- Monthly Musings
- Posts
- Common valuation metrics to start your investing research journey
Common valuation metrics to start your investing research journey
Supratik Sarkar
May 01, 2023
I am very excited to bring you this newsletter on Valuation, a topic I am very intrigued with. This is easily one of my most favorite ones I’ve written along with the 10 Trillion Indian Economy and Digtal Public Goods. It focuses mainly on surface level metrics to filter out the best companies based on valuation. This isn’t a deep dive on how to study moat, quality of earnings, forecasting earnings or forensic accounting but it’s an easy point to start your investing research journey with. Hope you like reading it as much as I loved researching it and would love to get your feedback. I’ll link the other topics mentioned above once I publish them so stay tuned 🙏
10X Pre-tax Earnings: Time entry
A favourite of Warren Buffett, most of his largest and best deals like Coca-Cola, American Express, Walmart and Apple have followed this ratio. Pretax earnings or PBT/EBT (Profit/Earnings before taxes) is considered to be a good valuation for entry into fundamentally strong and growing companies with long history. Prices far above 10x EBT is a good time to sell. But why favor pretax earnings over other metrics? Post-tax earnings dont reflect business fundamentals. Taxes can change due to factors beyond business fundamentals, such as tax laws in different geographies, capital structure changes etc. However, two major risks are quality and valuation. Quality risk/Value trap = purchasing low-quality asset at a bargain, valuation risk = expensive high-quality asset. This rule is primarily intended to mitigate valuation risk after quality risk has been addressed. Essential to avoid low-quality company at cheap prices.
FCF/EV: Free Cash Flow Yield
Free Cash Flow = Operating cash flow – (Capex+ Advances for capex) – Investment in subsidiaries, intercorporate deposits.
The higher the yield, the better. FCF is the actual money a company makes after paying for expenses and assets required to operate normally. Research on Indian equities suggests, earnings growth accounts for only 14.4% of share price returns, PAT growth 47.6% returns and FCF growth 59.4%. FCF growth is by far the biggest driver of shareholder value, especially for Indian companies’ v/s using PE to value companies which ignores real cash earnings of companies.


FCF Growth has the one of the strongest correlations with share prices among popular metrics, Source: Marcellus Investment Managers, Ace Equity
Same research shows starting trailing PE can explain 0% of share price growth v/s using price to present value of expected FCF explaining 9%. While 9% is still more than 0% which shows how FCF growth is still a better metric, it also shows how little current stock prices have effect on future share price returns for Indian companies.

Starting trailing PE explains 0% of share price growth. Source: Marcellus Investment Managers, Ace Equity

Price to PV of FCF explains 9% of share price growth. Source: Marcellus Investment Managers, Ace Equity
FCF growth captures growth of a business far better than P/E does because FCF is nothing more than ROCE less the cost of capital. Therefore, healthy growth in FCF necessarily implies equally healthy growth in ROCE.
Economic Value Added: Calculate fair value
Aka economic profit, as it attempts to capture the true economic profit of a company.
EVA = Net operating profit after tax – (cost of capital x capital employed) whereapital employed = Debt + capital leases + shareholders' equity
Using this value we arrive at, Fair Value= Present Value of EVA for each year (if using previous or future estimates, similar to DCF)
However, it relies heavily on the amount of invested capital and is best suited for asset-rich, stable or mature companies. Companies with intangible assets, such as technology businesses, may not be ideal candidates for EVA evaluation, which is a big reason why just P/E ratios leads to undervaluing such companies.

Using EVA (@12% WACC) to arrive at Fair Values for high PE companies shows the undervaluation when focusing just on PE multiples, June 2010 – December 2022, outperformned the market by 33% . Source: Marcellus Investment Managers
Most of these high P/E companies at a 45% discount to fair value. Bucket 1 is capital goods companies that generated negative/zero EVA due to the capex downturn in India from FY11-22. They had a negligible fair value in 2010, despite being valued at billions by the stock market. Bucket 2 had asset-light FMCG/consumer-facing companies, fairly or overvalued. Bucket 3 had asset-light consumer-facing and FMCG companies, significantly undervalued. Market rewards consistency of growing EVA. The higher the ROCE, the bigger this surplus is and when reinvested efficiently year after year, this reinvested surplus snowballs to create wealth for shareholders.

Combined with EVA, ROCE can filter stocks that give even better returns. Source: Marcellus Investment Managers
CFO/EBITDA :Real earnings
EBITDA is profits from core business activities but on accrual basis (recognition when sale is made). CFO to EBITDA gives a better picture on how much cash the company is generating from EBITDA since CFO works on cash basis (recognition when cash is received). ~0.6 and up is considered to be a good value especially for B2B businesses that shows the firm has less money stuck in working capital. B2C companies have very low trade receivables since they receive cash immediately and thus reflect very high CFO/EBITDA (>~70%).
We use EBITDA instead of PAT (Profit After Tax) to make sure other income from non-core business activities and taxation doesn’t distort the view and lets us compare companies across sectors or industries. Once you filter the companies, you can then further study their inventory and receivables as a % of sales to understand why the ratio is low or high compared to peers. Higher these percentages, poorer the working capital and worse the ratio.
An increase in earnings means an increase in Net Worth but not in cash distributable to the owners. As long-term investors, the hope is for a company to eventually return more cash than invested, typically in the form of dividends. However, if majority of the earnings are in the form of non-cash assets like receivables, then the company can’t sustainably return cash to investors. For example, a $1 increase in net worth can be achieved by a $0.50 increase in accounts receivable and a $0.50 decrease in accounts payable, without affecting the company's cash on hand.
Management can choose whether to reinvest excess cash or return it to owners, and they should only reinvest when they expect to earn attractive returns. Thus, high CFO/EBITDA ratios and high reinvestment rates can be a great way to identify cash generating companies poised for growth.
CWIP to Net Block :Huge capex and depreciation adjusments
Net Block = Cost of property, plant, equipment (aka. gross block) – Depreciation
Capital work in progress (CWIP) represents costs incurred on a fixed asset, which is still under construction.
Using filters like CWIP > Net block 3/5 years back can be easy ways to filter companies that have currently undertaken massive capex. However, CWIP can’t be always verified by the auditor and depends on the management. Additionally, depreciation can’t be charged on it. Companies where CWIP as a percentage of current gross block is consistently very high consistently over 3-5Y time periods should be avoided. Focus on companies that aren’t just doing capex but also consistently converting CWIP into gross block. To compare capex to total asset base, CWIP to gross block is better, to compare capex to the companies net asset value (accounting for depreciation) CWIP to net block is better.
EBIT/EV & ROCE : Magic Formula
Joel Greenblatt annualized 17.1% CAGR in 1988-2020 using this (v/s SP500 9.2%) and has been replicated (in backtests) to be successful even in Indian equities for 2002-2020 @ 30% CAGR (v/s Nifty50 12.7%), consistently outperforming Nifty50 in every 5Y period for the 18Y backtest period.
The strategy is to invest in companies with high ROCE (EBIT/(Net Fixed Assets + Working Capital)) and high earnings yield (high EBIT/EV, means a bargain price because low debt & high income).
Net fixed assets = fixed assets - depreciation and any liabilities associated with the asset, gives a more accurate sense of the real value of a company's assets.
Working capital = current assets minus current liabilities, gives a picture of whether the company is likely able to continue operations in the short term.
Even EBITDA/EV aka the enterprise multiple seems to be an effective measure of capturing such value premium based on research, outperforming both on raw and risk-adjusted returns. It captures a higher degree of systematic mispricing than other value metrics like book-to-market, earnings-to-market etc.
Combine ranking for both and invest in a basket of the top 25, equal-weighted. Financials are excluded because their business model are different and hence these ratios are inappropriate and same for negative Net Worth companies because negative Net Worth amplifies RoCE. Additionally, in cyclical and commodity sectors, you have to sell the stocks when the companies are generating peak RoCE instead of buying them. To deal with this, including companies in the universe if their last 7 years median RoCE is more than 15% can be a solution. Unfortunately, it involves an annual rebalancing by selling businesses with high Magic Formula ranks a year after purchasing them. This step is crucial because it looks for temporarily mispriced stocks in the market that will return to its mean value within a year, not quality businesses that should be held for the long term and selling within a year. This is a tax heavy event for an investor even if u hold the winners for longer than a year and losers sold at less than a year to benefit from long term and short-term capital gains tax differential.
EV/EBITDA :Acquirer’s Multiple
Outperformed the Magic Formula in US markets from 1972-2017, with the latest data being 16.1% from 1964-2020 (v/s SP500 @10.4%). The strategy bets on cheap companies, even ignoring quality, for the sake of mean reversion for long time periods.
EV = Enterprise Value = Market Capitalization + Debt – Cash
EBITDA = Earnings Before Interest, Taxes and Depreciation & Amortization
P/E ratio only looks at the residual income generated for equity shareholders and ignores debt capital and operating profitability. Stock superficially undervalued on a book value basis is recognized as being fully valued, or overvalued once its debt load is factored in. It can also be tricky for loss-making companies, startups, and cyclical companies but AM can be computed even for firms reporting net losses.
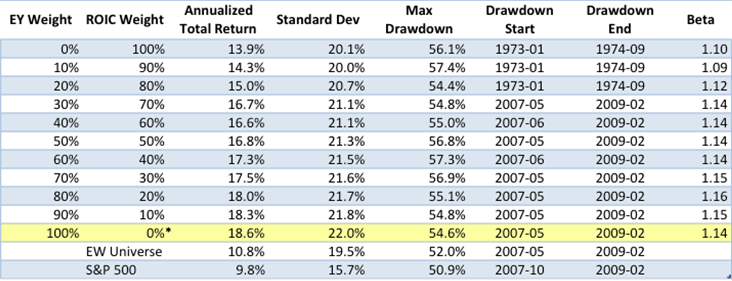
Earnings Yield (EY) and ROIC/ROCE from Magic Formula and how focusing just on EY gives better risk adjusted returns, backtested on US stocks with Mcap>$400M, from 1973 to 2012. Source: Euclidean Technologies
However, it overlooks cash flow nature and expenditure, including capex and interest. EV/EBITDA can also be misleading for capital-intensive businesses like airlines and auto ancs (which typically sell at low EV/EBITDA ratios). While Buffet is not fond of using EV independently because depreciation irrespective of recognition is a real cost and EBITDA can be manipulated using capitalized expenses (like Enron did), Tobias Carlisle, who popularized the ratio, believes that fair companies at wonderful prices beat wonderful companies at fair prices because great businesses don't stay great. They only look great at the top of their business cycle. Mean reversion pushes great business back to average especially when time periods are 20 years or more.
Shareholder Yield
=Dividend yield (over previous 12 months - special dividends) + % net share buybacks over the previous 12 months.
Larger stocks have historically underperformed over the long term which means there’s room for improvement for the large market cap stocks which as a basket are considered to be more efficient. Research shows large-cap companies that return value to shareholder in terms of both dividends and buybacks usually outperform the rest of the market. Companies repurchase their own shares when the stock is undervalued, which sends a message to investors that the management believes its stock is trading below intrinsic value. Additionally, shares are sometimes bought back to offset dilution from employee stock grants. However, repurchases can also be used to manage or boost earnings per share. Investors should focus on companies repurchasing stock for undervaluation reasons, rather than for managing EPS or dilution.
Gross Buyback Yield = Total share repurchases / market capitalization
Net Buyback Yield = (Total share repurchases - total share issuance) / market capitalization
Focus on “net” buyback yield, which takes share issuance into account alongside buybacks.

Earnings quality is a huge factor in choosing stocks with higher buyback yield. Can be a 5.5% CAGR loss on choosing companies with low quality of earnings. Source: OSAM Research
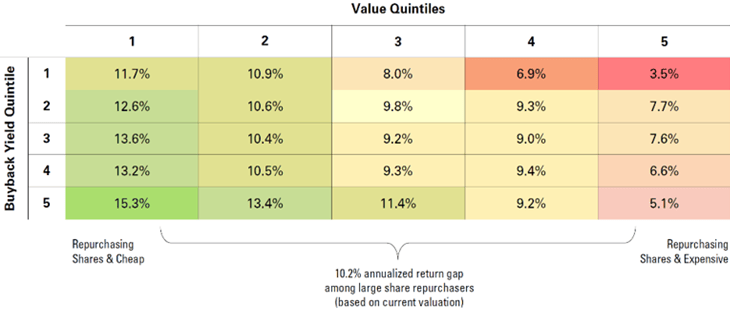
Value is a huge factor in choosing stocks with higher buyback yield. Can be a 10.2 CAGR loss on choosing the most expensive ones. Source: OSAM Research
However, the same research also shows buying such companies at expensive valuations can be brutal and hence shareholder yield should ideally combined with other value factors to ensure a good price and quality of earnings growth to ensure continual rising yields. This research was conducted on stocks in US markets, further research needs to be done for Indian markets to check their validity considering Indian markets have different correlations between value and returns as shown by FCF yield and also systemically different dividend yields.
Residual Income
Financial companies dont use 3 parts of the traditional cash flow model which is why they require to be valued differently. Debt in Financial Services firms is more like raw material that is used to make loans and earn Net Interest Margin (NIM). As a result, the payments made to debt providers are part of operating expenses rather than interest payment. Measuring reinvestment needs for Financial Services firms is an issue as they primarily invest in intangible assets such as brands and human capital, and not in fixed assets. Also, working capital cannot be calculated in the traditional way, as a large proportion of a bank's balance sheet would fall either into current assets or current liabilities Thus, neither the free cash flows nor the reinvestment rate, as used for non-financial firms, can be used. A great alternative is the residual income. calculated as,
Intrinsic Value of Equity = Equity capital invested currently (i.e. current book value) + Present value of Expected excess returns to Equity investors (i.e. ROE – COE)
Sources:
https://www.oldschoolvalue.com/investing-strategy/the-best-value-stock-screening-ratios/https://www.brokenleginvesting.com/acquirers-multiple/
Disclaimer: The opinions expressed in the Blog are for general informational purposes only and are not intended to provide specific advice or recommendations for any individual or on any specific security or investment product. It is only intended to provide education about the financial industry. The views reflected in the commentary are subject to change at any time without notice. Nothing on this Blog constitutes investment advice, performance data or any recommendation that any security, portfolio of securities, investment product, transaction or investment strategy is suitable for any specific person. From reading this Blog we cannot assess anything about your personal circumstances, your finances, or your goals and objectives, all of which are unique to you, so any opinions or information contained on this Blog are just that – an opinion or information. You should not use this Blog to make financial decisions and we highly recommended you seek professional advice from someone who is authorised to provide investment advice.